Peptide testing is the analytical process used to verify that a research peptide is both pure and correctly identified. HPLC measures chromatographic purity by separating the target peptide from related impurities and calculating main-peak area percent. Mass spectrometry confirms molecular identity by checking whether the measured mass matches the expected peptide mass. For research-grade peptide qualification, HPLC and LC-MS/ESI-MS answer different questions and should be read together.
Peptide testing is broader than a single purity number. A complete analytical review asks four practical questions: is the target peptide present, is it the correct molecular identity, how much impurity is present, and is the batch documentation specific enough to audit? High-Performance Liquid Chromatography (HPLC) remains the core method for peptide purity testing, but it is only one part of the quality-control picture. HPLC shows how much of the detected UV signal belongs to the main peptide peak. Mass spectrometry shows whether that peak corresponds to the intended peptide mass. A Certificate of Analysis (COA) should make both pieces of evidence visible enough for a researcher to evaluate, not merely repeat a marketing claim.
This guide expands the original HPLC explainer into a broader peptide testing reference. It preserves the HPLC depth while adding the surrounding methods researchers need to understand: ESI-MS identity confirmation, LC-MS impurity profiling, what other specialized tests can prove, how to interpret a chromatogram, how to spot weak documentation, and why Apex Laboratory’s Lab Verified archive pairs HPLC purity with mass spectrometry peptide verification for batch-level confidence.
What Is Peptide Testing?
Peptide testing is the set of analytical checks used to evaluate a peptide sample before it is used in a research workflow. In practical COA review, the term usually refers to purity testing, identity testing, and documentation review. Purity testing asks how much of the detected sample is the main peptide versus related impurities. Identity testing asks whether the measured mass or sequence-related evidence matches the intended peptide. Documentation review asks whether the report is batch-specific, traceable, and detailed enough to be audited.
That distinction matters because “tested” can mean very different things depending on the supplier. A peptide can be HPLC-tested for purity without mass confirmation. It can be mass-confirmed without a useful impurity profile. It can have a generic COA that is not tied to the vial lot being shipped. The strongest documentation connects the specific batch to instrument-generated data: chromatogram, retention time, main-peak area, impurity peaks, expected mass, observed mass, test date, batch identifier, and analyst or laboratory attribution. For a field where related impurities can arise during synthesis, purification, handling, or storage, a one-line purity claim is not the same as a complete peptide test report.
Published peptide-analysis literature uses liquid chromatography and mass spectrometry together for impurity characterization, identity confirmation, and quantification of structurally related peptide species. For example, LC-HRMS has been used to identify and quantify structurally related impurities in synthetic human C-peptide reference materials, and LC-MS reviews describe the challenges of characterizing synthetic peptides because related modifications and manufacturing impurities can be subtle rather than visually obvious on a label alone (PMID: 29862433; PMID: 34110145).
Peptide Testing Methods: What Each Test Proves
No single analytical method proves everything. A strong peptide testing workflow uses methods that answer complementary questions. The table below is the practical way to think about common tests when reading a peptide COA.
| Method | Primary question answered | What it does not prove by itself |
|---|---|---|
| HPLC / UHPLC | How much of the chromatographic signal belongs to the main peptide peak? | It does not confirm that the main peak is the correct peptide identity. |
| ESI-MS / LC-MS / HRMS | Does the measured molecular mass match the expected peptide mass? | It does not automatically replace a quantitative purity chromatogram. |
| LC-MS impurity profiling | What related impurities or degradation products may be present? | It depends on method design, ionization behavior, and reference interpretation. |
| Amino acid analysis / quantitative standards | How much peptide material is present by absolute content methods? | It is not the same as HPLC area-percent purity. |
| Specialized assays such as chiral purity, residual solvent, water content, or endotoxin testing | Specific risks outside ordinary purity/identity review. | They are context-dependent and are not automatically part of every research-peptide COA. |
HPLC is the most visible method on research peptide COAs because it produces an intuitive purity percentage. Mass spectrometry is the critical companion because it checks identity. Additional specialized assays may be relevant for some peptide classes, formulations, or regulated contexts, but the baseline research-vendor question is simpler: does the supplier provide batch-specific HPLC purity data and mass confirmation that can be inspected?
Analytical peptide literature supports this layered view. HPLC is widely used for biologically active peptide assessment, while peptide quantification can also involve amino acid analysis, elemental analysis, derivatization chemistry, and UV-based methods depending on the reference-material question (PMID: 23061275; PMID: 26879647). Specialized issues such as enantiomeric purity require their own analytical treatment and should not be assumed from a standard HPLC area-percent number alone (PMID: 38448043).
What Is HPLC? The Basic Principle
HPLC stands for High-Performance Liquid Chromatography, sometimes called High-Pressure Liquid Chromatography. At its core, it is a separation technique: it takes a complex mixture, such as a peptide sample that may contain the target peptide plus impurities, degradation products, or synthesis byproducts, and separates those components so they can be detected independently.
The fundamental principle is simple. Different molecules have different chemical affinities for two phases: a stationary phase, the material packed inside a chromatography column, and a mobile phase, the solvent flowing through the column. When the sample is injected into the mobile-phase stream and pushed through the column, each molecular species interacts differently with the stationary phase. Molecules that interact strongly move more slowly. Molecules that interact weakly move more quickly. This differential interaction causes the components to separate as they travel through the column and emerge at different retention times.
For peptide purity testing, reverse-phase HPLC is the standard conceptual model. The target peptide ideally appears as one dominant peak. Related impurities appear as smaller peaks at different retention times. The chromatographic purity is then calculated by comparing the area under the main peak with the total area under all integrated peaks.
The Components of an HPLC System
A modern HPLC system consists of several integrated components, each serving a specific function in the separation and detection process.
Solvent Reservoirs and Pump
The mobile phase, often a mixture of water, acetonitrile, and an acid modifier, is stored in reservoirs and delivered through the system by a high-pressure pump. The pump maintains precise flow rates, commonly in the range of 0.5 to 2.0 mL/min depending on the method and column format. High pressure forces the mobile phase through tightly packed particles inside the column, producing sharper separations and higher resolution than traditional low-pressure chromatography.
Autosampler and Injector
The peptide sample is dissolved in a compatible solvent and loaded into an autosampler. The injector introduces a precise volume of sample into the mobile-phase stream. Consistent injection volume matters because overloading the column can broaden peaks, distort purity estimates, or hide nearby impurities.
Chromatography Column
The column is the heart of the separation. For peptide analysis, reverse-phase C18 columns are commonly used. The stationary phase consists of silica particles modified with 18-carbon hydrocarbon chains. Peptides interact with these chains based on hydrophobicity: more hydrophobic species generally bind more strongly and elute later, while more hydrophilic species pass through faster. Column chemistry, particle size, temperature, and gradient design all influence the quality of the final chromatogram.
UV Detector
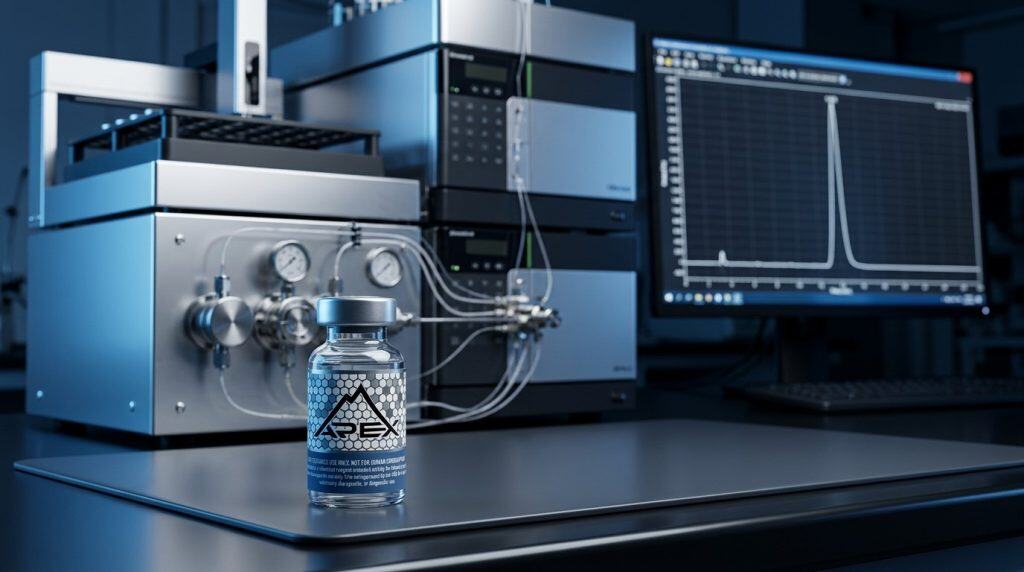
As each separated component exits the column, it passes through a detector. Peptide bonds absorb ultraviolet light strongly near 214 nm, while aromatic amino acid residues can also be monitored near 280 nm. The detector output is recorded as a function of time, generating the chromatogram: the graph that appears on a well-documented HPLC-based Certificate of Analysis.
Reading an HPLC Chromatogram
The chromatogram is the most important visual data element on an HPLC peptide test report. It is a graph with time on the horizontal axis and detector response, usually UV absorbance, on the vertical axis. Each peak represents a component that was separated and detected.
What a Good Chromatogram Looks Like
- One dominant, sharp, symmetric peak: the target peptide should be the main peak and should account for nearly all integrated peak area in a high-purity sample.
- A flat, stable baseline: the region between peaks should be clean enough that peak integration is meaningful. A noisy or drifting baseline weakens confidence in small impurity quantification.
- Minimal secondary peaks: in a >=99% sample, combined impurity peaks should account for less than 1% of total integrated peak area.
- Method information: a useful report should show enough method detail, such as column type, wavelength, retention time, and gradient context, to interpret the result.
What a Concerning Chromatogram Looks Like
- Multiple peaks of similar height: this suggests the sample contains multiple components in substantial amounts rather than one dominant peptide.
- A broad or asymmetric main peak: peak broadening can reflect method or loading problems, while persistent asymmetry may indicate coeluting impurities.
- Shoulder peaks: a shoulder beside the main peak can indicate a closely related impurity that the method has not fully resolved.
- Missing raw chromatogram: a COA that reports only a purity percentage without a chromatogram gives the reader little ability to evaluate the claim.
How HPLC Purity Percentage Is Calculated
The purity percentage reported on a peptide COA is usually calculated using peak area comparison. The software controlling the HPLC system integrates, or measures, the area under each peak on the chromatogram. Purity is then calculated as:
Purity (%) = (Area of main peak / Total area of all integrated peaks) x 100
If the main peptide peak has an area of 99,200 units and all integrated peaks combined total 100,000 units, the HPLC purity is 99.2%. This is why HPLC purity is often described as chromatographic purity or area-percent purity: it is derived from peak area ratios under the selected method conditions.
At Apex Laboratory, research peptide batches are evaluated against a >=99% HPLC purity threshold before release. Batches that do not meet the internal acceptance threshold are not made available for sale. That purity number is then paired with mass confirmation so the COA is not relying on a purity claim alone.
Peptide Testing at Apex: HPLC Purity + ESI-MS Identity
Every released Apex peptide batch is reviewed with HPLC purity testing and mass spectrometry identity confirmation. View the Lab Verified COA archive · Learn how to read a peptide COA
Why HPLC Alone Is Not Enough: The Role of Mass Spectrometry
HPLC is excellent at answering the question “how pure is this sample by chromatographic area percent?” It does not, by itself, prove that the main peak is the intended peptide. A sample could produce a clean-looking chromatogram with one dominant peak and still be the wrong compound if identity was never confirmed. HPLC measures separation and relative peak area; mass spectrometry measures mass-to-charge behavior that can be used to confirm molecular identity.
This is why Apex pairs HPLC with ESI-MS. Mass spectrometry measures whether the observed mass aligns with the expected molecular weight of the target peptide. If the observed mass is consistent with the target, identity confidence increases. If the mass does not match, a high HPLC purity percentage cannot rescue the batch because the material may not be the intended peptide. LC-MS and HPLC-QTOF-MS/MS literature specifically highlights the value of mass-based methods for characterizing structurally related peptide impurities and synthetic peptide modifications (PMID: 34110145; PMID: 35840670).
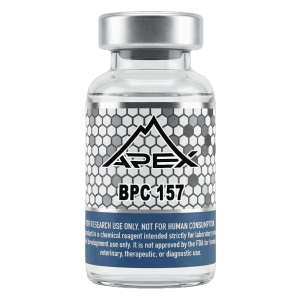
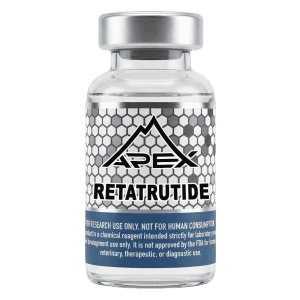
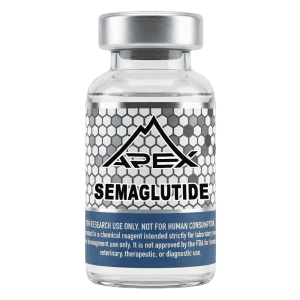
For examples of product-level context, compare the expected masses for Retatrutide, BPC-157, and Semaglutide. Each peptide has a different expected molecular weight, so mass confirmation is not a generic badge; it is compound-specific evidence. For a deeper identity-focused explanation, see Mass Spectrometry Peptide Verification.
What Peptide Testing Can and Cannot Prove
Peptide testing is powerful, but researchers should read the scope of each method carefully. A strong test report can support purity, identity, and batch traceability. It does not turn a research compound into a clinical product, and it does not replace experimental validation in the researcher’s own system.
What HPLC Can Support
HPLC can support claims about chromatographic purity, impurity peak burden, and degradation trends when the method is appropriate and the chromatogram is available. If a peptide is re-tested after storage stress, HPLC can reveal whether new impurity peaks have appeared or whether the main peak area has declined. This connects directly with handling topics such as peptide storage and peptide reconstitution.
What HPLC Cannot Prove Alone
HPLC alone cannot prove sequence identity, absolute content, biological activity, sterility, endotoxin level, or suitability for any clinical use. A clean chromatogram is necessary evidence, not complete evidence. For research-vendor COA review, the most important pairing is HPLC plus mass spectrometry: purity plus identity.
What Other Tests May Add
Other tests answer narrower questions. Amino acid analysis or other quantitative approaches can support absolute content. Chiral methods can address enantiomeric purity where stereochemistry is a concern. Residual-solvent or water-content tests can matter in manufacturing or stability contexts. These are valuable in the right setting, but they should be interpreted as method-specific evidence rather than a universal replacement for HPLC and MS.
Types of Impurities HPLC Detects
The minor peaks that appear on a chromatogram alongside the main peptide peak represent various types of impurities. These can arise during peptide synthesis, purification, drying, storage, or reconstitution.
Deletion Sequences
During solid-phase peptide synthesis, amino acids are added sequentially. If a coupling step is incomplete, the result can be a deletion peptide: a sequence missing one or more residues compared with the intended target. Deletion products are often structurally similar to the target and may require well-designed chromatographic conditions to resolve.
Deamidation Products
Asparagine and glutamine residues can undergo deamidation, changing the peptide’s charge and hydrophobicity. That change can produce a new peak on the chromatogram. Deamidation is one reason storage conditions matter, especially after a peptide has been reconstituted.
Oxidation Products
Methionine and cysteine residues can be susceptible to oxidation. Oxidation changes molecular properties and can shift retention behavior, creating distinct chromatographic peaks or related mass shifts.
Truncation and Fragmentation Products
Partial peptide fragments can result from incomplete synthesis or post-synthesis degradation. These fragments are usually smaller than the target peptide and may elute at different retention times. HPLC can show the presence of additional peaks; LC-MS can help assign likely identities to those related species.
HPLC Method Parameters That Matter
Not all HPLC analyses are equally informative. The quality and reliability of a peptide purity measurement depend on method parameters and documentation quality. When evaluating a COA, researchers should look for the following details.
- Column type: C18 reverse-phase columns are standard for many peptide analyses, but column chemistry affects separation quality.
- Particle size: Smaller particles can provide higher-resolution separations than larger particles. UHPLC systems using sub-2 micrometer particles can sharpen peaks and improve impurity detection.
- Gradient program: Gradient elution changes solvent composition over time so compounds of different hydrophobicity elute in sequence. A short or poorly designed gradient can hide impurities.
- Detection wavelength: Peptide bonds are commonly monitored near 214 nm, with 280 nm sometimes used when aromatic residues are relevant.
- Run time: Sufficient run time helps ensure late-eluting impurities are not missed.
- Integration settings: Peak area depends on how the software draws baselines and integrates shoulders. A report should show the raw chromatogram, not only the final number.
- Batch traceability: A COA should connect the analytical result to the lot being shipped. A generic or undated report is weaker evidence.
How to Read Peptide Testing Results
A peptide test report should be read as a set of converging signals. Start with the batch identifier. Confirm that the COA is tied to the product lot, not a generic product family. Then read the HPLC chromatogram: identify the main peak, retention time, impurity peaks, total area, and reported area-percent purity. Next, read the mass spectrum or mass-spec summary: compare observed mass with expected mass for the peptide. Finally, check whether the documentation has enough detail to be independently assessed.
Apex’s How to Read a Peptide COA guide walks through this process step by step. The companion page on why 99 percent purity matters explains why small impurity percentages can still matter in sensitive in-vitro assays. Together with this peptide testing guide, those pages form the trust-methodology layer behind the product catalog.
Frequently Asked Questions
What is peptide testing?
Peptide testing is analytical verification of a peptide sample. In COA review, it usually includes HPLC purity testing, mass spectrometry identity confirmation, and batch-specific documentation showing the tested lot, method, results, and date.
How are peptides tested?
Research peptides are commonly tested by HPLC or UHPLC for chromatographic purity and by ESI-MS or LC-MS for molecular identity. Additional tests, such as amino acid analysis, chiral purity, water content, or residual-solvent testing, may be used when a specific quality question requires them.
What does HPLC-tested mean?
HPLC-tested means the sample was run through high-performance liquid chromatography to separate the target peptide from impurities. The purity percentage is usually calculated from the main peak area divided by the total integrated peak area.
How do you verify peptide purity and identity?
Purity and identity require different evidence. HPLC verifies chromatographic purity. Mass spectrometry verifies whether the measured mass matches the expected peptide mass. A strong peptide COA includes both.
What is peak purity on a peptide COA?
In the common peptide COA context, peak purity usually refers to the percentage of total chromatogram area represented by the main peptide peak. It is an area-percent purity measurement, not a complete identity or activity test.
Can HPLC detect peptide degradation?
Yes. HPLC can reveal new impurity peaks, increased shoulder peaks, or a reduced main-peak area after storage or handling stress. It is one reason proper peptide storage and reconstitution practices matter.
Why does Apex use both HPLC and mass spectrometry?
Apex uses both because they answer different questions. HPLC answers “how pure is the sample?” Mass spectrometry answers “is the detected compound consistent with the intended peptide identity?” Together they provide stronger batch-level evidence than either method alone.
Shop COA-verified research peptides
Explore flagship research peptides with batch-specific COA documentation and HPLC/MS verification. Products are for in-vitro laboratory research use only and are not for human consumption.
Continue Your Research
- How to Read a Certificate of Analysis (COA) for Research Peptides
- Mass Spectrometry Peptide Verification
- Why 99 Percent Peptide Purity Matters
- Peptide Storage Guide: Temperature, Stability & Shelf Life
- How to Reconstitute Peptides
- Retatrutide
- BPC-157
- Semaglutide
Research Use Disclaimer
This article is provided for educational and research reference purposes only. All peptides sold by Apex Laboratory are intended exclusively for in-vitro laboratory research use and are not for human consumption. Peptide testing documentation should be interpreted as batch-level analytical evidence for research material, not as clinical-use authorization.